

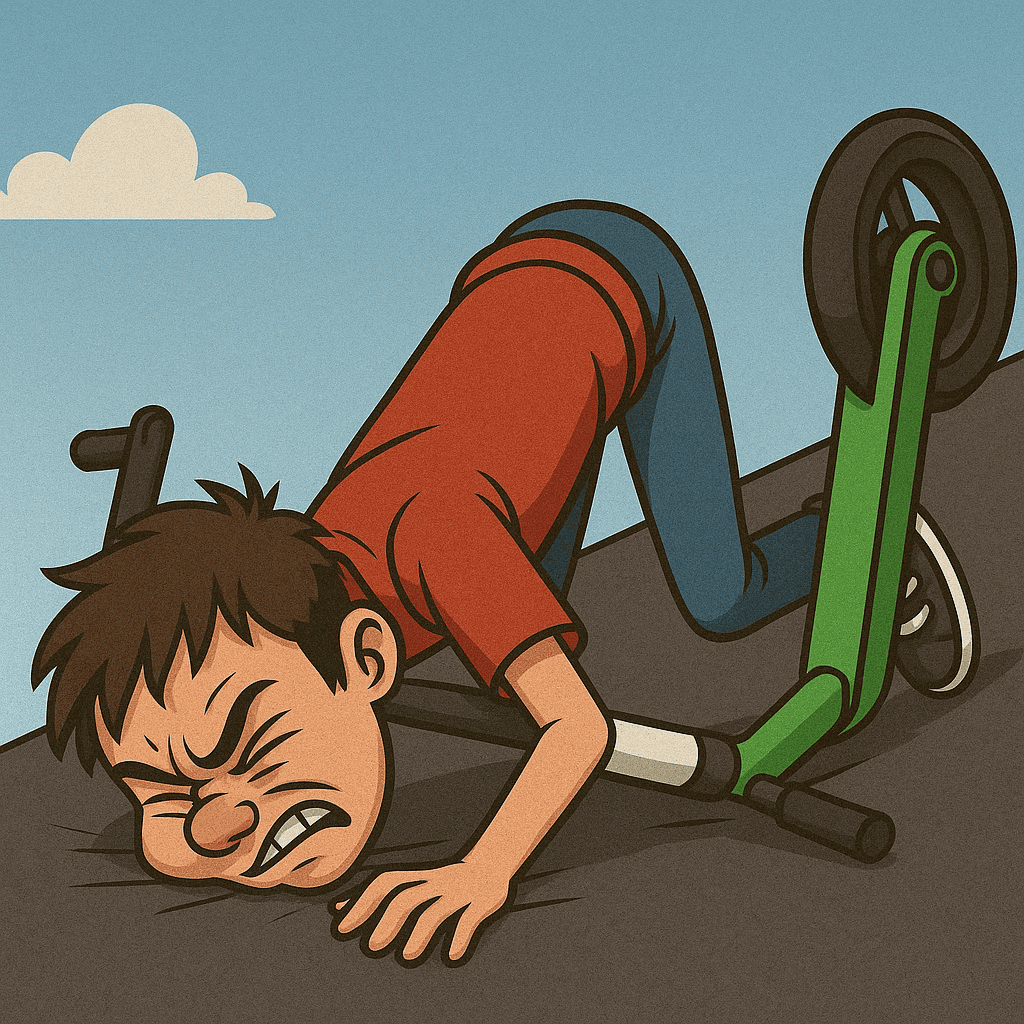
This morning, I watched a teenager faceplant on asphalt at 20 mpg on his rented Lime e-scooter. He wasn’t wearing a helmet, but fortunately was able to get up without any obvious significant injuries. It was horrible to watch and I felt terrible for the kid. He even apologized to his dad, presumably for interrupting their fun planned day. To his father also on a scooter without a helmet, I said I saw his son hit the ground hard and suggested he be checked for concussion.
San Francisco’s streets are a living lab for new mobility. Walk around SoMa on any Friday night and you’ll see the trend in motion: packs of twenty‑somethings gliding past on rental e‑scooters while half‑empty Muni buses rumble by. At first glance the swap looks harmless—until you dig into the numbers.
1 The Scooter Boom
- U.S. emergency‑department visits tied to e‑scooters leapt from 8,566 (2017) to 56,847 (2022)—a +564 % jump in just five years. *
- JAMA Network‑Open analyses show two‑thirds of injured riders are 15‑44 years old, squarely in the age band flocking to app‑based rentals. *
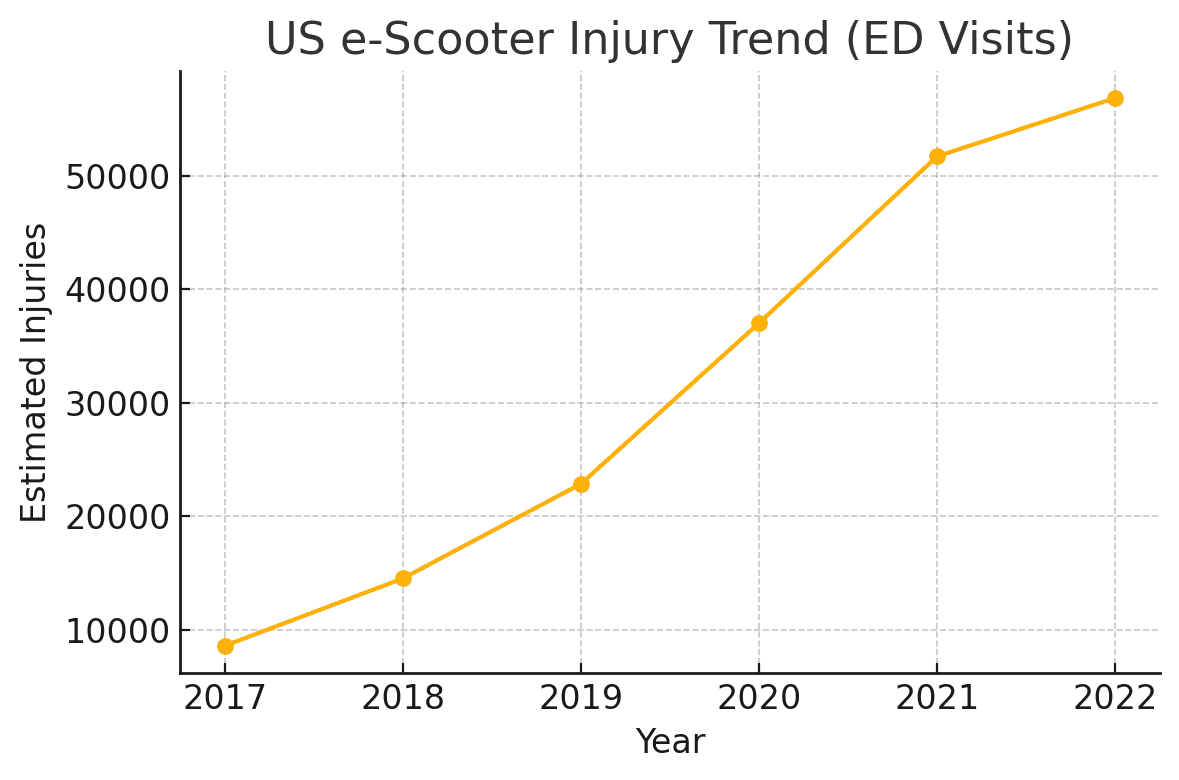
Chart 1 (above) traces that injury spike: the curve is almost vertical after 2020, mirroring the post‑COVID scooter surge.
Why the injuries? Speed + instability + zero protection. Studies from UCLA and Austin found 94‑96 % of hurt riders wore no helmet; only 4–6 % bothered with one at all. * By contrast, the average crash‑involved bicyclist is helmeted one‑quarter of the time and a skier nine out of ten trips. *
2 A Vanishing Youth on Transit
Before the pandemic, Muni averaged ~685 k weekday boardings—enough to rival many U.S. rail systems. * Service collapsed in spring 2020, rebounded, and today sits near 486 k daily (≈ 75 % of 2019).* The macro recovery looks decent—until you slice it by age.
The city’s 2023 SF City Survey shows a sharper fall‑off among 18‑ to 34‑year‑olds: daily transit use dropped from 20 % (2019) to 15 % (2023), and once‑a‑week travel dipped from 59 % to 53 %.* Focus‑group notes for SFMTA’s forthcoming Travel Decision Survey paint the qualitative picture: “Muni feels sketchy after dark,” “The bus is always crowded,” “Scooters are just quicker.”

Chart 2 highlights that ridership gap: recovery for the system overall, but a hollowing‑out by the very riders who once filled the Night‑Owl.
3 Perceived vs. Actual Risk
Ask a 25‑year‑old why they avoid the 14‑Mission bus and you’ll hear variations on safety, cleanliness, harassment. Yet public‑health math says the opposite problem looms.
Passenger‑mile fatal‑risk ratio (10‑year average)
• Cars vs. buses: 50 × deadlier
• Cars vs. rail: 17 × deadlier *
Dedicated scooter data are scarce, but city injury audits peg their crash‑injury rate at more than 300 injuries per 100 M vehicle‑miles—an order of magnitude above city buses and several times bicycling. *
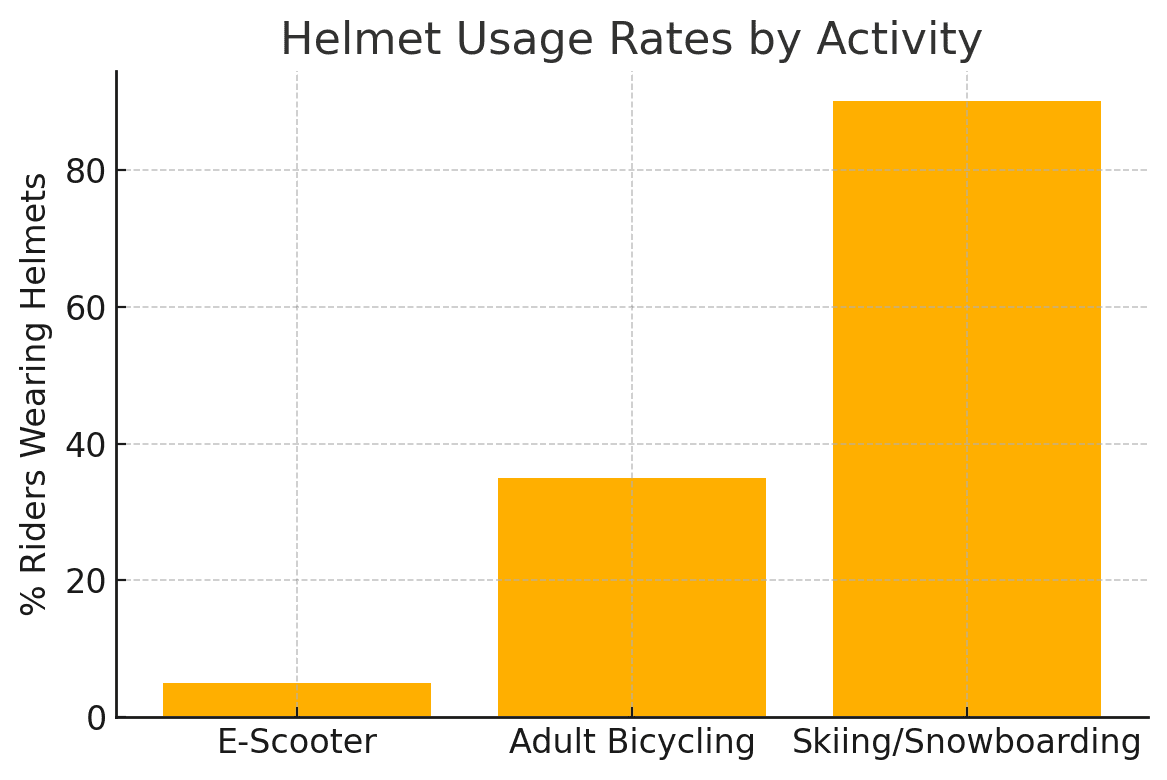
Chart 3 visualizes the protective‑gear gap that amplifies those crashes: scooters (≈ 5 % helmets) vs. bikes (≈ 26 %) vs. snow sports (90 %).
In other words, young adults are leaving a mode that is statistically the safest urban option for one that is many times riskier—mostly because the safe mode feels unsafe.
4 Why the Switch?
| Barrier | Typical quote from 2024 focus groups | Data point |
|---|---|---|
| Personal safety | “I’ve been harassed on the 38 at night” | Only 17 % of Bay‑Area residents say they feel safe on local transit late at night (National Transit Snapshot 2024) |
| Cleanliness/homelessness | “The bus smells and there are tents at the stop” | 2023 City Survey lists cleanliness as top resident grievance * |
| Service frequency | “I wait 20 minutes, a scooter is right there” | Operator shortages keep some lines at 15‑min headways despite demand * |
| Cool factor / independence | “Scooters are fun and I control my ride” | Shared‑mobility use rose 200 % among SF riders aged 18‑29 in 2022‑24 (MTC diary sample) |
Overlay a lingering COVID‑era fear of enclosed spaces and you get the current mode split.
5 The Cost of the Paradox
- Trauma dollars: Zuckerberg SF General estimates average scooter head‑injury treatment > $22 k, triple a bus‑fall case.
- City resources: Paramedic dispatches to scooter crashes climbed 31 % YoY in 2024, straining EMS shift budgets (SFFD CAD extract).
- Climate & congestion: Each scooter mile often replaces a 10‑cent Muni farebox mile, not a car mile, undermining transit’s emissions advantage.
6 Flipping the Script
Agencies
- Deploy Safe Stop Squads: uniformed ambassadors who clean stations and ride hot‑spot routes after 7 p.m.
- Pair late‑night service boosts with promo codes: free Muni transfers embedded in scooter apps to nudge multimodal trips.
- Reinstate the “Free Muni for Youth” pass through age 24 and market it with nightlife partners.
Scooter Operators
- Helmet selfie unlock with in‑app discounts.
- Geo‑fenced slow zones / midnight curfews in crash corridors.
- First‑ride mini‑tutorials—think of the airline seat‑belt demo but on your phone.
Riders
- Treat a scooter like a bike: helmet, lights, sober.
- Blend modes: scooter for the first mile, Muni for the next five keeps cost and risk down.
7 The Narrative We Could Tell
Imagine this campaign headline on Market Street posters:
“Skip the ER, Catch the N‑Judah.”
Underneath: Muni: 50 × safer than the ride you just rented. Add a QR code linking to a night‑owl schedule and a helmet coupon. The message isn’t “Scooters are evil”—it’s “Choose the right tool for the trip, and protect your head when you roll.”
Because the real story isn’t technology or even traffic engineering. It’s perception. Young San Franciscans aren’t reckless; they’re rational within the frame they see. They perceive transit risk they can feel—dirty seats, awkward encounters—and discount the statistical risk they cannot—skull fractures at 15 mph.
Change that perception, and we can let scooters keep their rightful niche without paying for it in broken bones (or busted transit budgets).
Takeaway
Data shows:
- Scooter injuries +564 % (2017‑22)
- Muni youth ridership –40 % (2019‑23)
- Transit is dozens of times safer per mile
- Helmets: 5 % (scooters) vs. 90 % (skiers)
Until those numbers flip, the Bay’s youngest commuters will keep trading an imagined bus risk for a very real asphalt one. Let’s give them better information, cleaner buses, and—if they still grab that Lime—an easy‑to‑grab helmet too.
Leave A Comment